top of page


Recent map of monitoring network on Reykjanes
Seismic stations showing turbulence graphs in Iceland (click red dot for each station)

The red squares on the map indicate the location of the Meteorological Office seismometers. The tremor graphs show average vertical movement per minute for each seismometer, in three frequency ranges (Hz).The vertical axis has the same scale for each station. The main purpose of these graphs is to monitor changes in intensity of seismic wave motion. The absolute value of the scale has no meaning. Many phenomena can influence the intensity, for example wind, ocean waves and traffic. Sometimes floods and volcanic tremor can be detected. Earthquakes appear as spikes on the graphs. From here you can view tremor plots from all our seismic stations.
Drumplots of seismic stations to follow in Reykjanes
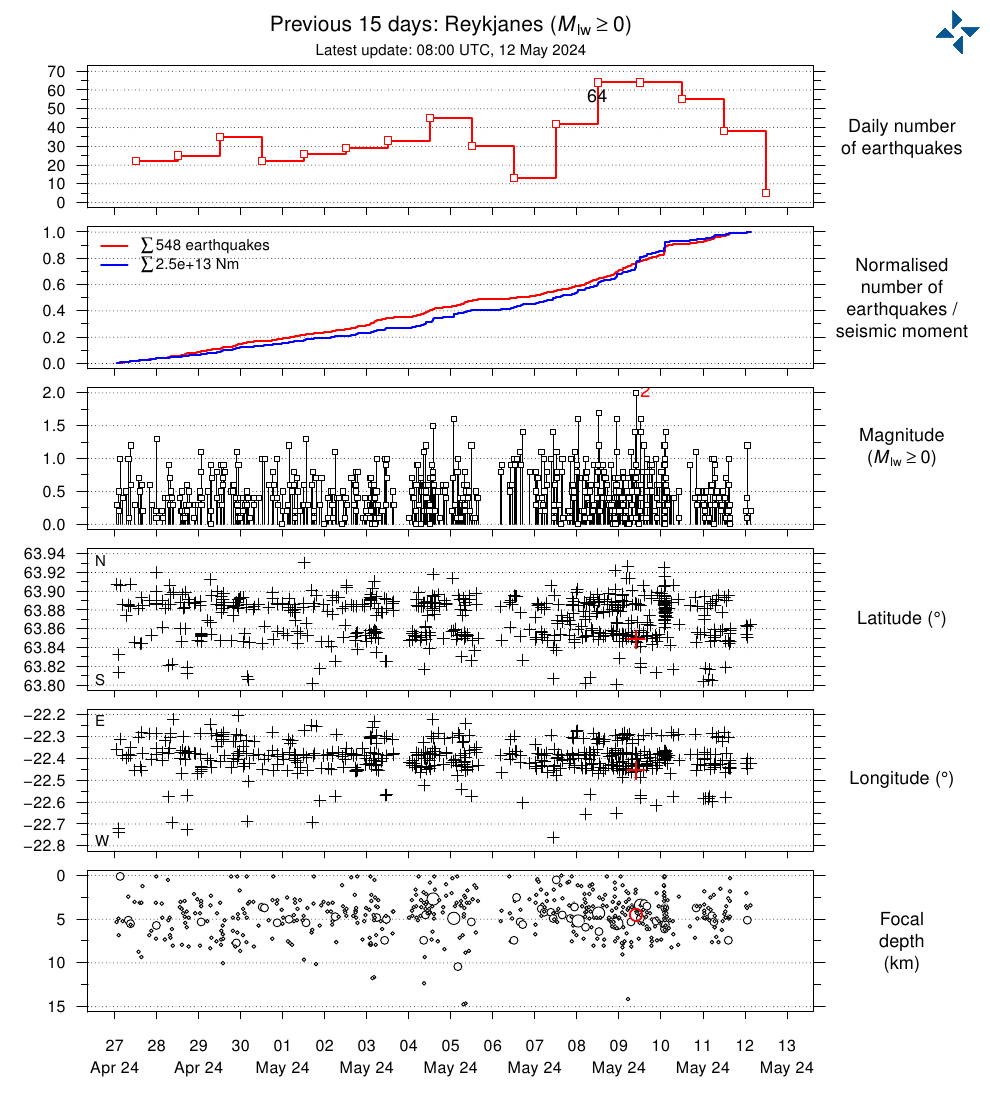
Seismicity data Iceland per area

Seismicity data Snaefellsness

The blue dots around the map indicate the location of the IMO seismometers around Oraefajokull. Click on them to view the tremor graphs. The graphs show average vertical movement per minute for each seismometer, in three frequency ranges (Hz).The vertical axis has the same scale for each station.
Seismic Stations SIL
bottom of page